TetraSkills

DataScience & Analytics

Data Science and Analysis is a powerful and versatile domain used to derive insights, make data-driven decisions, and solve complex problems. It consists of key methodologies such as Data Extraction, Data Preparation, Data Modeling, and Visualization, all of which work seamlessly together. At Tetraskills, we specialize in training future-ready professionals to master the skills and tools of Data Science and Analysis and excel in creating impactful solutions for modern businesses.

Enroll Today – Classes Begin: Soon
Registration Open
Price : 14000/- INR

200 hr +

Programme

600 +

Students  Enrolled

Offline Batch

In our Learning Center

Online Batch

Connect from any where

Internship

Opportunities

About DataScience & Analytics Course

Data Science and Analysis is a powerful and versatile domain used to derive insights, make data-driven decisions, and solve complex problems. It consists of key methodologies such as Data Extraction, Data Preparation, Data Modeling, and Visualization, all of which work seamlessly together. At Tetraskills, we specialize in training future-ready professionals to master the skills and tools of Data Science and Analysis and excel in creating impactful solutions for modern businesses.

Industry-Relevant Skills:

Master the tools and technologies that are in demand across leading industries.

Hands-On Experience:

Work on real-world projects to gain practical knowledge and confidence.

Expert Guidance:

Learn from experienced professionals who provide insights and mentorship.
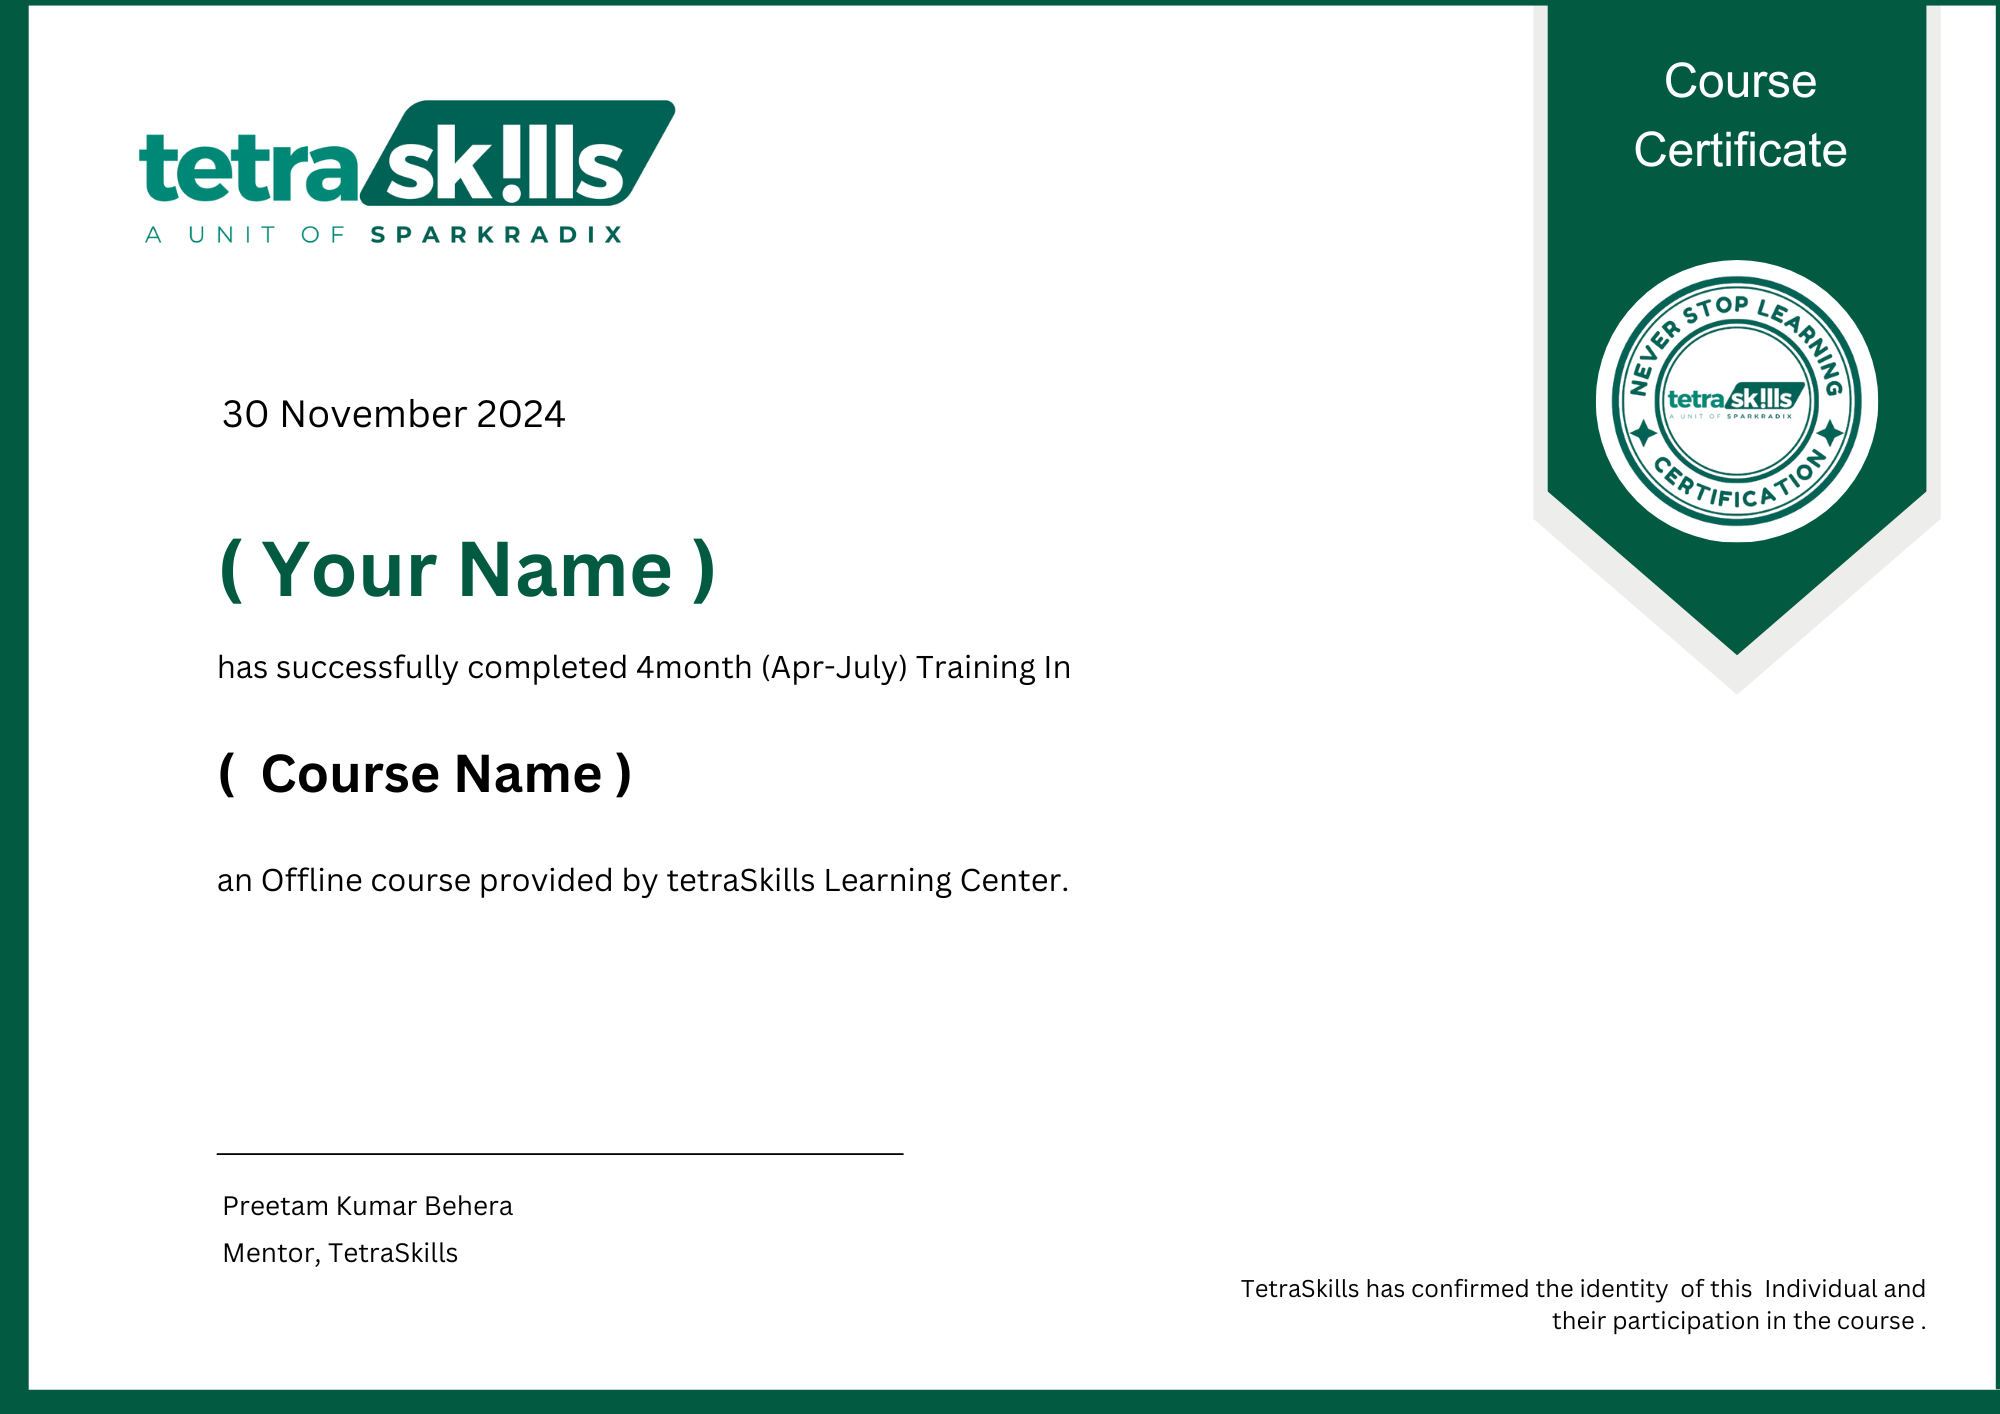
Certification:

Industry renowned internship & course completion certification

Career Opportunities:

Enhance your employability with skills that stand out in the competitive job market.

Comprehensive Learning:

Gain a deep understanding of both foundational and advanced concepts.

Personal Growth:

Develop problem-solving, communication, and teamwork skills essential for success.

Career Transition:

More than 1200 learners upgraded their careers in the last 12 months

Course Offerings

Diverse Project Portfolio

Practice Exercises

Doubt Clearing Sessions

Dedicated Buddy Support

Industry Oriented Curriculum

Industry Recognized Certificate

Q&A Forum

Instructor Led Sessions

Peer to Peer Networking

Email Support

Mock Interviews 

Module Level Assignments

Become a Tools Expert

Course Structure

Fundamentals

Key Areas Covered

  1. Introduction to Data Science & Analytics

    • Understanding the role of Data Science in modern business decision-making.
    • Key differences between Data Science, Data Analytics, and Data Engineering.
    • Real-world use cases across industries.
  2. Data Types and Formats

    • Structured, Semi-Structured, and Unstructured Data.
    • Common data formats: CSV, JSON, Excel, SQL databases.
  3. The Data Science Lifecycle

    • Data Collection: Gathering data from various sources (databases, APIs, web scraping).
    • Data Cleaning: Removing inconsistencies, handling missing data, and ensuring quality.
    • Data Analysis: Identifying trends and patterns.
    • Data Visualization: Presenting insights through graphs, charts, and dashboards.
    • Interpretation and Communication of Results.
  4. Tools for Data Science and Analytics

    • Programming Languages: Python, R.
    • Data Manipulation Libraries: Pandas, NumPy.
    • Visualization Libraries: Matplotlib, Seaborn, Tableau.
    • SQL for database querying and manipulation.
  5. Introduction to Statistics

    • Basic statistical measures (mean, median, mode, standard deviation).
    • Probability basics and its application in data analysis.
  6. Problem-Solving with Data

    • Formulating data-driven questions.
    • Exploratory Data Analysis (EDA) to uncover insights.
  7. Ethics in Data Science

    • Understanding bias in data.
    • Privacy and confidentiality in handling datasets.
Basics
  • Introduction to Python Programming
    Learn the basics of Python, including syntax, code structure, and running Python programs.

  • Variables, Data Types, and Operators
    Understand how to store, manipulate, and use data with variables, data types (strings, integers, etc.), and operators.

  • Control Structures (if-else, loops)
    Master decision-making and repetition in Python using conditional statements and loops.

  • Functions and Modules
    Explore reusable blocks of code with functions and how to use/import modules for added functionality.

  • Introduction to Python Libraries: NumPy, Pandas, and Matplotlib
    Get familiar with essential libraries for data manipulation, analysis, and visualization.

  • Data Manipulation using Pandas
    Learn to clean, filter, aggregate, and transform datasets efficiently using Pandas.

  • Working with Arrays using NumPy
    Perform numerical computations and work with multi-dimensional arrays using NumPy.

  • File Handling and Exception Handling
    Understand how to read/write files and handle errors gracefully during execution.

  • Exploratory Data Analysis (EDA) Techniques
    Analyze datasets to discover patterns, trends, and insights using Python tools.

  • Data Visualization with Seaborn and Matplotlib
    Create stunning and informative charts and graphs to present your data.

  • APIs and JSON Data Processing
    Learn to interact with APIs to retrieve data and process JSON data for analysis.

  • Basic Statistics using Python
    Apply statistical methods like mean, median, mode, variance, and more using Python.

  • Advanced Data Wrangling
    Dive deep into reshaping, merging, and cleaning complex datasets for analysis.

  • Database Integration with Python (SQLAlchemy, SQLite)
    Connect Python to databases, perform queries, and integrate SQL for data storage and retrieval.

  • Automation and Script Development
    Build scripts to automate repetitive tasks and improve efficiency in data workflows.

  • Real-World Applications and Case Studies
    Apply all learned skills to real-world scenarios and work on hands-on projects to solidify knowledge.

Basics
  1. Introduction to Statistics
    Learn the foundation of statistics, including its role in data analysis and decision-making.

  2. Measures of Central Tendency (Mean, Median, Mode)
    Understand how to summarize data using measures that represent the center of a dataset.

  3. Measures of Dispersion (Variance, Standard Deviation)
    Explore how to measure data spread and variability within datasets.

  • Probability Concepts and Distributions
    Study the basics of probability, probability distributions (normal, binomial, etc.), and their applications.

  • Hypothesis Testing
    Learn to formulate and test hypotheses to draw conclusions about population parameters.

  • Correlation and Regression Analysis
    Understand relationships between variables and predict outcomes using linear regression models.

  • Sampling Methods and Techniques
    Explore different sampling techniques and their importance in statistical analysis.

  • Analysis of Variance (ANOVA)
    Learn how to compare means across multiple groups to identify significant differences.

  • Time Series Analysis
    Study data that varies over time, identify trends, and make forecasts using statistical methods.

  • Multivariate Statistics
    Analyze datasets with multiple variables and understand techniques like PCA, cluster analysis, and factor analysis.

  • Bayesian Statistics
    Learn probabilistic inference using Bayes’ theorem and apply Bayesian approaches to statistical modeling.

  • Statistical Model Validation
    Ensure the accuracy and reliability of statistical models through validation techniques like cross-validation and residual analysis.

Basic Topics
  1. Introduction to Data Visualization
    Understand the importance of data visualization in data analysis and decision-making.

  2. Fundamentals of Visualizing Data
    Learn key principles of effective data visualization, including clarity, simplicity, and accuracy.

  3. Creating Basic Plots (Bar, Line, Scatter)
    Start creating simple yet powerful visualizations such as bar charts, line graphs, and scatter plots.

  1. Data Visualization with Matplotlib
    Master Python’s foundational visualization library to create static and dynamic plots.

  2. Advanced Visualizations with Seaborn
    Explore advanced statistical visualizations such as box plots, violin plots, and pair plots.

  3. Dashboard Creation with Tableau
    Learn to build interactive dashboards and visual storytelling using Tableau.

  1. Interactive Visualizations using Plotly
    Create interactive and engaging charts such as 3D plots, animated graphs, and more using Plotly.

  2. Storytelling with Data Visualizations
    Learn to design visualizations that effectively communicate insights and narratives.

  3. Heatmaps, Pair Plots, and Other Advanced Charts
    Dive into advanced visualizations like heatmaps and multi-variable pair plots for deeper insights.

  1. Building Data Dashboards
    Create comprehensive and interactive dashboards for real-time data monitoring and reporting.

  2. Best Practices for Effective Visualization
    Learn design principles to ensure your visualizations are clear, impactful, and professional.

  3. Real-World Visualization Projects
    Apply your skills to real-world projects, integrating multiple visualization tools and techniques.

Basic Topics
  1. Introduction to Machine Learning
    Learn the core concepts of Machine Learning, its applications, and its role in modern technology.

  2. Types of Machine Learning (Supervised, Unsupervised, Reinforcement)
    Understand the three main types of machine learning and when to apply each.

  3. Preparing Data for Machine Learning
    Learn data preprocessing techniques, including cleaning, transforming, and splitting data for model training.

  • Linear Regression and Logistic Regression
    Explore regression techniques for predicting continuous and categorical outcomes.

  • Clustering Techniques (K-Means, Hierarchical)
    Learn how to group data points into clusters based on their similarities.

  • Feature Engineering and Scaling
    Master techniques to extract meaningful features and scale data for optimal model performance.

  • Decision Trees and Random Forests
    Understand tree-based algorithms for classification and regression tasks.

  • Model Evaluation and Metrics (Confusion Matrix, ROC Curve)
    Learn to evaluate model performance using metrics like accuracy, precision, recall, and ROC-AUC.

  • Dimensionality Reduction (PCA)
    Simplify datasets while retaining essential information using Principal Component Analysis (PCA).

  1. Introduction to Neural Networks
    Understand the basics of neural networks, including structure and activation functions.

  2. Basics of Deep Learning
    Learn foundational concepts of deep learning, including multi-layered networks and backpropagation.

  3. Building End-to-End Machine Learning Models
    Gain hands-on experience building and deploying machine learning models for real-world applications.

Basic Topics
  • Introduction to Big Data
    Understand the concept of Big Data, its characteristics (volume, velocity, variety), and its importance in modern analytics.

  • Basics of Distributed Systems
    Learn how distributed systems enable Big Data processing by dividing tasks across multiple nodes.

  • Overview of Hadoop Ecosystem
    Get familiar with the key components of Hadoop, including HDFS, MapReduce, and YARN.

  • Working with HDFS
    Learn to store, manage, and retrieve large datasets using the Hadoop Distributed File System.

  • Basics of Apache Spark
    Explore the fundamentals of Apache Spark, a fast and general-purpose engine for large-scale data processing.

  • Data Processing with MapReduce
    Understand the MapReduce programming model for processing large datasets in a distributed environment.

  • Real-Time Processing with Spark Streaming
    Learn how to process and analyze streaming data in real-time using Apache Spark.

  • Hive and Pig for Big Data Analysis
    Explore Hive for SQL-like querying and Pig for data transformation and analysis in the Hadoop ecosystem.

  • Introduction to Cloud Platforms for Big Data (AWS, Azure, GCP)
    Discover how cloud platforms offer scalable solutions for Big Data storage and processing.

  1. Handling Large Datasets with Spark MLlib
    Use Spark’s MLlib library for scalable machine learning on large datasets.

  2. Optimizing Big Data Pipelines
    Learn techniques to improve the efficiency and reliability of data pipelines.

  3. Big Data Project Implementation
    Apply Big Data tools and techniques to build and deploy end-to-end projects in real-world scenarios.

Introduction to Node.js
Goal: Understand the basics of Node.js and set up your environment.
 
  1. Introduction to Node.js:
– What is Node.js?
– Why use Node.js?
– Node.js architecture and event-driven model.
 
  1. Setup:
– Install Node.js and npm (Node Package Manager).
– Verify installation with node -v and npm -v.
 
  1. First Steps:
– Write a simple “Hello World” program.
– Execute JavaScript files using Node.js.
Goal: Learn about the core modules and concepts in Node.js.
 
  1. Modules:
– Understanding built-in modules (e.g., fs, http, path).
– Learn how to import and use modules.
 
  1. File System:
– Reading from and writing to files.
– Working with directories.
 
  1. Creating a Simple Server:
– Use the http module to create a basic web server.
– Understand request and response objects.
Goal: Master asynchronous programming in Node.js.
 
  1. Callbacks:
– Understanding the callback pattern.
– Handling errors in callbacks.
 
  1. Promises:
– Introduction to Promises.
– Converting callback-based functions to use Promises.
 
  1. Async/Await:
– Using async/await syntax for cleaner asynchronous code.
– Error handling in async/await.

Build Projects from Scratch

Customer Churn Prediction Project

The Customer Churn Prediction project is a data-driven application designed to predict whether a customer is likely to stop using a product or service. Built using Python and essential data science libraries, this project demonstrates the use of machine learning techniques to solve real-world business problems.


Key Features:

  • Data Processing: Preprocesses raw customer data to clean, transform, and prepare it for model training.
  • Exploratory Data Analysis (EDA): Identifies key patterns and trends in customer behavior that lead to churn.
  • Machine Learning Model: Implements algorithms like Logistic Regression or Random Forest to predict churn probabilities.
  • Visualization: Uses Matplotlib and Seaborn to create visual insights like feature importance and churn trends.
  • Actionable Insights: Provides predictions to help businesses target at-risk customers and improve retention strategies.

This project is an excellent practice for applying machine learning, EDA, and data visualization techniques while solving a critical business challenge.

Sentiment Analysis of Social Media Data

The Sentiment Analysis of Social Media Data project is a natural language processing (NLP) application designed to analyze public sentiment on social media platforms like Twitter. Using Python and popular NLP libraries, this project identifies whether a post conveys positive, negative, or neutral emotions.


Key Features:

  • Data Collection: Leverages APIs like Twitter API to collect real-time or historical social media posts.
  • Data Preprocessing: Cleans and processes text by removing noise, such as hashtags, mentions, links, and stop words.
  • Sentiment Classification: Uses machine learning models or pre-trained NLP tools like TextBlob or VADER to classify sentiment.
  • Visualization: Generates visual reports such as pie charts and bar graphs to display sentiment distribution across the data.
  • Insights for Decision Making: Helps businesses or organizations understand public perception about their brand, products, or campaigns.

This project is an excellent opportunity to practice NLP techniques, API integration, and data visualization, providing valuable insights for sentiment-driven decision-making.

Sales Forecasting Dashboard

The Sales Forecasting Dashboard project is a comprehensive data analytics application designed to visualize historical sales trends and predict future sales using time series analysis. Built using Python, Pandas, and visualization tools, this project offers actionable insights for businesses to optimize inventory and revenue strategies.


Key Features:

  • Data Analysis: Processes historical sales data to identify trends, seasonality, and anomalies.
  • Time Series Forecasting: Implements forecasting models like ARIMA or Prophet to predict future sales accurately.
  • Interactive Visualization: Creates dynamic charts and graphs using tools like Matplotlib, Plotly, or Tableau for clear and engaging dashboards.
  • Customization: Allows users to filter and drill down into data by categories, regions, or time periods.
  • Actionable Insights: Provides predictions to help businesses with demand planning, budgeting, and decision-making.

This project is an excellent practice for mastering time series analysis, forecasting models, and dashboard creation, helping businesses make data-driven decisions effectively.

Fraud Detection System

The Fraud Detection System project is a machine learning application designed to identify and prevent fraudulent transactions in financial systems. By analyzing patterns and anomalies in transaction data, this project helps businesses mitigate risks and protect their customers.


Key Features:

  • Data Preprocessing: Cleans and prepares transaction data, handling imbalances using techniques like SMOTE (Synthetic Minority Over-sampling Technique).
  • Anomaly Detection: Identifies unusual patterns using clustering methods like K-Means or distance-based algorithms.
  • Machine Learning Models: Utilizes classification algorithms such as Logistic Regression, Random Forest, or Gradient Boosting to predict fraudulent activities.
  • Visualization: Creates dashboards to visualize fraud trends, flagged transactions, and model performance metrics like precision and recall.
  • Real-Time Monitoring: Enables integration with APIs to monitor transactions in real-time and raise alerts for suspicious activity.

This project is ideal for practicing data preprocessing, classification techniques, and anomaly detection, providing valuable skills for real-world risk management and financial analytics applications.

Meet your Mentors

Our Alumni's are in

Get Certified

Once you complete the course offline, complete the assignment and project, you will be able to get the Course certificate.
After Live project work for a minimum of 1 month, you will receive an Internship Certificate.

  • Attendance must be 60% offline Training Sessions and Internship.
  • After scoring at least 60% in the quiz & assignments.,
  • After Completing 1 Project in Internship Period.

Student Reviews

Success Stories

Talk to Our Counsellor

Get Expert Advice our Counsellor will reach within 24 hour

TetraSkills FAQ

What is the refund policy?

TetraSkills operates a strict no-refunds policy for all purchased paid courses. Once a course purchase is confirmed, payment cannot be refunded. This policy applies to all courses, irrespective of the price, duration, or the learner’s progress within the course.

To enroll in a course, you can:

  • Fill out the form for the course you are interested in, and our team will connect with you over the phone.
  • Alternatively, if you are in Bhubaneswar, you can visit our offline Learning Center directly for enrollment assistance.

TetraSkills does not directly provide job assistance or on-campus placements. Instead, we focus on equipping students with the skills and experience needed to succeed in placements. Our offerings include:

  • Mock interviews and group discussions.
  • Practical skill-building exercises.
  • Hands-on experience through internships with partner companies.
    Through these programs, students become placement-ready and gain the confidence to excel in their career paths.

Share Link

WhatsApp

Facebook

Twitter

Telegram